

Towards the end of last year I had a couple of posts, the first explaining the oil price crash of 2014 in terms of a simple supply-demand model and the second using this model to anticipate where the oil price may head in 2015 and 2016. In light of the supply, demand and price action of the last six months, both of these posts now need to be updated and revised.
In my Price Scenarios post, I forecast a Brent price of $56.50 for December 2015, and with Brent spot currently around $60, this is looking quite good. So far this is panning out in the right direction but for the wrong reasons which does not count as being correct in my book.
(click to enlarge)
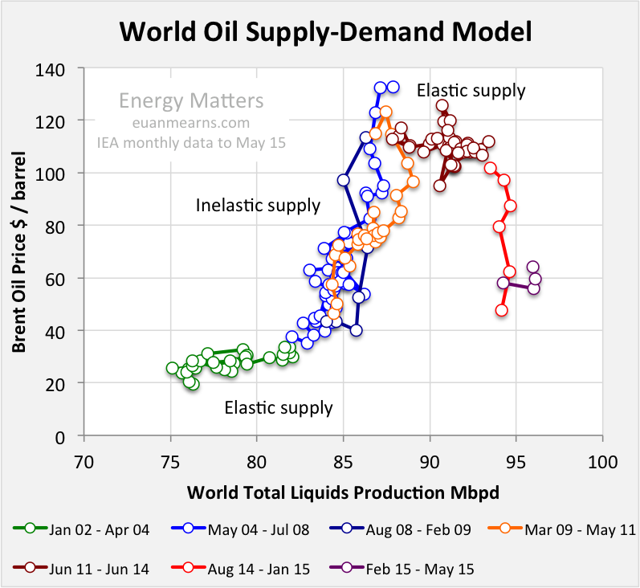
Figure 1
The raw oil price and production monthly data that lies behind the model can be divided into 7 legs. 1) January 2002 to April 2004 oil supply was elastic, allowing demand to grow with little impact on price…
(click to enlarge)
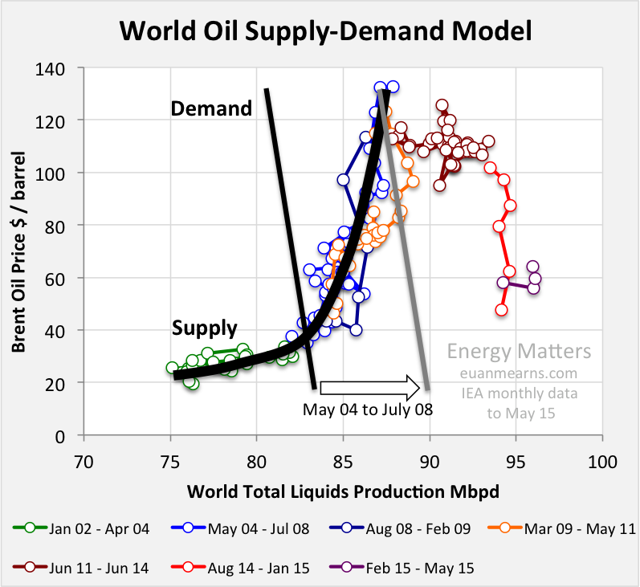
Figure 2 The supply and demand curves are based on a model first proposed by Phil Hart in an Oil Drum post from 2009 (link no longer working). Supply, fitted to the data, changes from elastic (low gradient) to inelastic (steep positive gradient). Demand (conceptual) is inelastic with steep negative gradient, i.e. high price will suppress demand but not by a lot. The price is struck where the supply and demand curves intercept. The movement of the inelastic parts of the supply and demand curves relative to each other can result in large movements in price for relatively small movements in supply or demand. The grey line shows how demand increased from 2004 to 2008 against inelastic supply sending the price sharply upwards (the intersection of the two curves, supply and demand, should always be balanced by price).
2) May 2004 to July 2008, OPEC spare capacity shrank and demand continued to rise against inelastic supply, sending the monthly average price up from $34 to $133/bbl (Figure 2)
(click to enlarge)
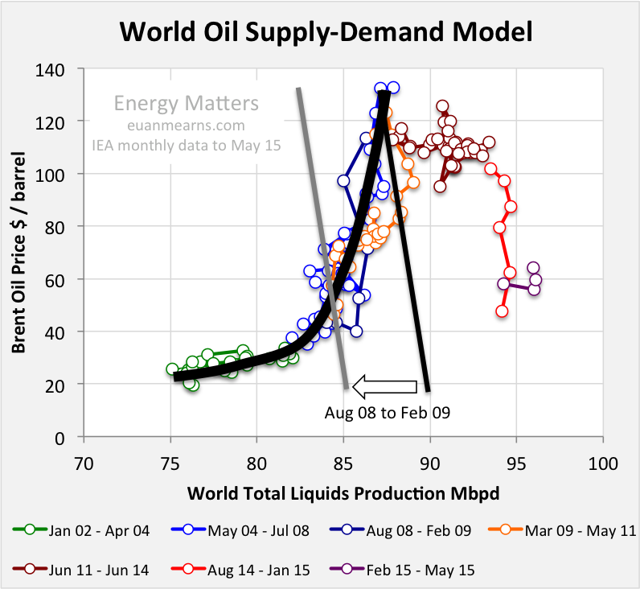
Figure 3 Between August 2008 and February 2009 demand collapsed, in part due to the unwinding of speculative positions, sending the oil price back to from whence it came.
3) August 2008 to February 2009, the financial crash, in part caused by high energy prices, saw demand collapse and the price retraced its ascent falling from $133 to $43/bbl (Figure 3).
4) March 2009 to May 2011, QE, debt inflation, OPEC supply reduction and overall management of our not so free markets saw the oil price recover to $123/bbl (Figure 1).
5) June 2011 to June 2014, the impact of shale drilling in the USA began to feed through to rapid supply growth which once again became elastic, allowing demand to increase with little impact upon price (Figure 1).
So far so good, these are the sequence of events described in my earlier posts. It is what happened next that is seriously at odds with my forecast. My 2015/16 price forecast was largely based on assumption that we were witnessing history repeat and that price collapse was to a large extent driven by weak demand combined with OPEC's decision to abandon the policy of restraint. What has happened can in fact be explained by over-supply alone.
(click to enlarge)
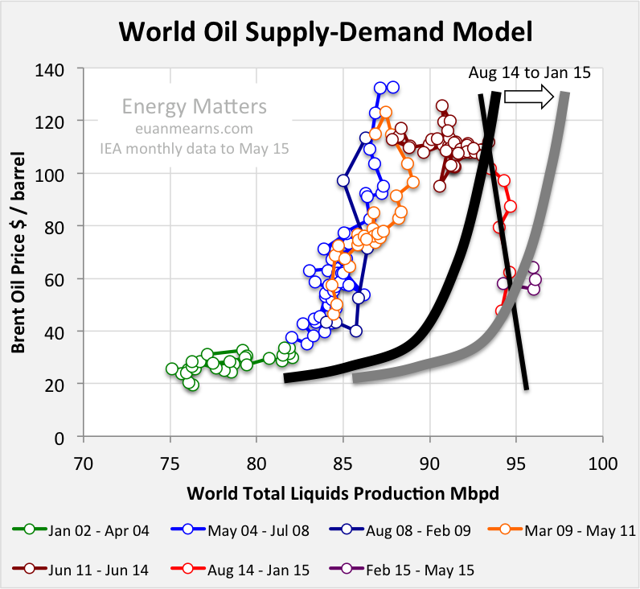
Figure 4 Since 2008 oil supply grew significantly, hence the supply curves have moved to the right. A significant increase in supply between August 2014 and January 2015 (grey curve) not met by an increase in demand, sent the oil price into a tail spin.
6) August 2014 to present saw supply increase from 93.1 to 96.1 Mbpd. A 3 million bpd supply increase against weak/static demand sent the price crashing down. Where did this oil come from? In the past, OPEC have cut supply by at least 3 Mbpd to support price and their failure to do so this time is sufficient explanation. If one needs further convincing of the over-supply argument, US production has risen by over 1 Mbpd from August 2014 to May 2015. There remains a weak demand component to the story in that in past cycles OPEC has managed weak demand by cutting supply. This time they have not resulting in over-supply.
(click to enlarge)
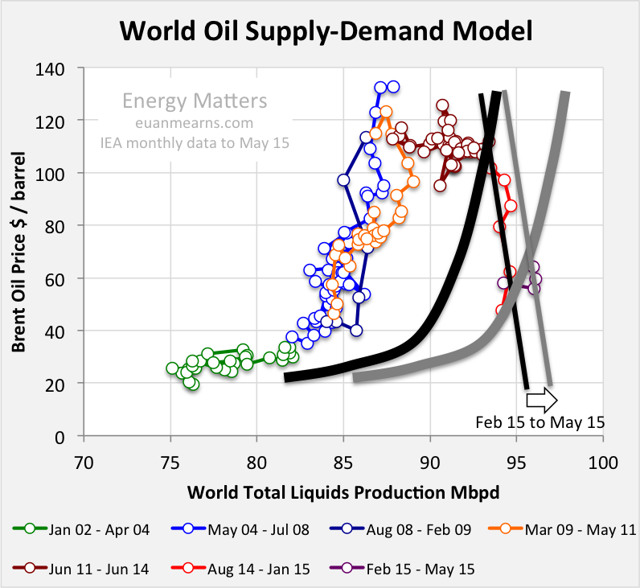
Figure 5
7) The final part of the story is that demand has risen, stimulated by low price, to mop up that extra supply and providing the recent support to the oil price, driving Brent back over $60/bbl (Figure 5).
What Was Wrong With Earlier Scenarios
There were two main problems with my Oil Price Scenarios for 2015 and 2016 post. The first is that I anticipated weak demand but went further and assumed that demand would fall as in 2008 and this would be the principle mechanism for price collapse. While demand then probably was weak, it did not fall. The second is that while I anticipated that supply may not fall for over a year, I did not anticipate the momentum for supply growth. Hence, the price movement thus far is largely as anticipated, but it has come about by supply growth and not a fall in demand.
What next?
It has always been a fickle black art to try and forecast the oil price. One of the first points to recognize is that the demand curve shown in all my charts, derived empirically from the 2002 to 2008 data may no longer apply. The global economy is littered with mine fields, the main one staring Europe in the face is GREXIT. The second is unsustainable debt levels in many major economies starting with Japan, followed by Italy, France, the UK, the USA and China. And there are geopolitical scars from the early skirmishes of WWIII all around the borders of Europe. These negative factors need to be weighed against the warm glow of cheap oil flowing through the global economy. I find it impossible to judge the balance between these forces.
On the supply front, it was widely anticipated that the collapse in US drilling would bring about a fall in LTO production by this summer that has so far failed to materialize. The US oil rig count is stabilizing at the 600+ level, and I am beginning to wonder if this might not be sufficient to sustain production levels. A significant drop might not occur. And thus far, significant falls in production have failed to materialize anywhere.
My Oil Price Scenarios for 2015 and 2016 anticipated a significant drop in production in 2016 that would send the price back up towards $100. Now I'm not so sure. The momentum built in recent years on the back of high price may take more than 12 to 18 months to dissipate. The industry is doing all it can to cut costs in order to adjust to the lower price environment. Those companies locked into high cost developments will pour gasoline on the bonfire and may have to chew losses for a number of years.
Recent history has not repeated and that makes it nigh impossible to predict the future with so many unconstrained variables.
Source: Euan Mearns