Andrew Hecht
Volatility spikes.
The bear case for crude going forward.
The bull case for crude going forward.
Volatility is likely to continue.
Where crude goes, many markets will follow.
I have found that over the long haul, fundamentals are a great indicator of price direction. There are times when technical factors are a better guide to price movements, particularly at the top or the bottom of a trend when technical metrics offer clues to the herd mentality of markets. Then there are the odd times. The times when one throws everything they have ever learned out the window. These are times when markets defy gravity, when they explode or implode. Those times truly test a trader's nerves. This is the case in the crude oil market these days, for trading the energy commodity over the past weeks has been like riding a psychotic horse through a burning barn. Only the nimble survive, and the stubborn wind up at the glue factory.
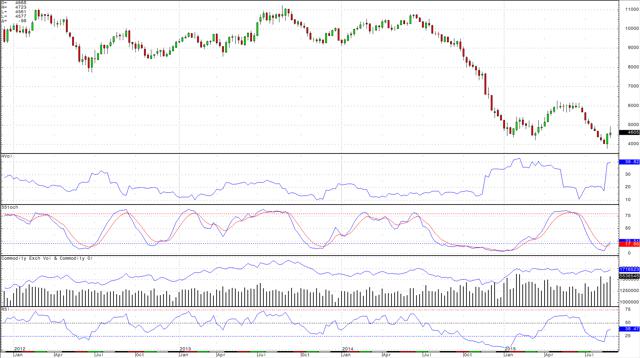
It has been more than a wild ride in crude oil since July. After consolidating at the $60 level, the price evaporated. Crude oil began falling in June 2014 when the price moved from highs of $107.73 to lows of $42.03 by March of 2015, a decrease of almost 61% over a ten-month period. The price then moved higher for nine straight weeks to highs of $62.58 - an increase of 49%. The fun started again in late June; NYMEX crude fell for eight straight weeks.
(click to enlarge)
The weekly chart of NYMEX crude oil highlights that after a two-month period of consolidation, crude oil plunged to new lows of $37.75 per barrel on August 24, a decrease of almost 40%. These moves are wild, but what followed the late August lows was enough to make even the most seasoned traders' heads spin.
(click to enlarge)
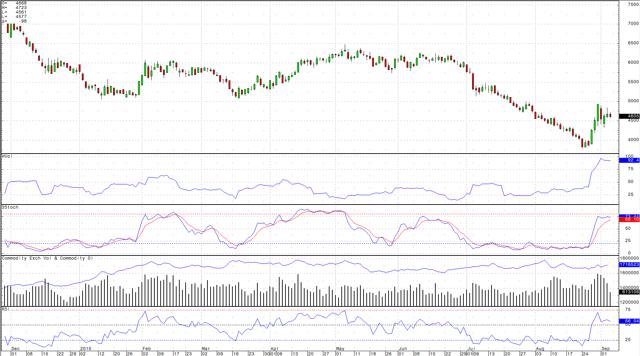
The daily chart of NYMEX active month October crude shows that after making lows on that fateful Monday in late August, oil proceeded to rally to $49.33 per barrel over a time span of one week. The increase of 30.7% occurred in a brief sharp and painful corrective rally for many. As the daily chart indicates, daily historical volatility now stands at an incredible 92.4% for NYMEX crude, the market that trades more like a bucking bronco than a commodity these days. In crude, it is hard to get a handle on this kind of volatility, and fundamental and technical analysis is of little help in terms of trying to determine what is going to happen each day.
When markets fall like crude has over the past year, the bears come out of the woodwork. Oddly enough, the same crowd that was calling for the energy commodity to fall to $30, $20 and lower back in March when it first made lows was singing the same tune in late August. The sharp and vicious rally sent them back into their hibernation, for now. However, the bear case is all about fundamentals in the oil market. On the supply side, the U.S. continues to pump over 9 million barrels per day. Russia is pumping over 10, and OPEC production is around 31.5 million each day, even though the cartel has a self-imposed ceiling of 30. It now looks like President Obama has secured enough votes to make the Iran deal stand. This means that sanctions will come off Iran and that will initially increase OPEC production on the order of a half a million barrels each day. Iran promises to pump even more in the future. Therefore, OPEC daily production is likely to be around 32 million barrels or more each day in the months ahead. In a sign that the market expects more Iranian output, the Brent versus WTI October spread closed lower on Friday at $3.56 per barrel. There is certainly a lot of oil around, which has weighed on price throughout the year.
On the demand side of the equation, the U.S. is the only major nation showing signs of moderate growth these days. Last week, the ECB lowered expectations for European growth out to 2017. ECB President Mario Draghi announced a reversion of the QE program in place until September 2016 at the earliest, so that the central bank has the ability to purchase even more member country debt. Europe is attempting to stimulate the economy amidst a series humanitarian crises emerging with respect to immigrants from the Middle East and North Africa flooding the continent. The recent bailout of Greece cost Europe plenty, and the European economy is likely to experience continued lethargy in the months and maybe even years ahead.
Meanwhile, the big story lately is the economic slowdown in China. Despite a government policy of "new normal" aimed at encouraging lower but stable growth, China continues to experience an economic slowdown. In an attempt to achieve the 7% growth target, the government has lowered interest rates five times so far in 2015. When the domestic stock market plunged in July, the Chinese instituted new rules and regulations to inhibit selling and encourage buying in the equity market. This caused stability for a couple of weeks, but then the market began to fall once again. The government floated a one trillion yuan bond to build infrastructure in the nation, another attempt to stimulate the lethargic economy. Finally, and most recently, the government devalued the currency in an effort to stimulate Chinese exports. The initial devaluation may only be the first in a series of haircuts for the yuan, which has a peg to the strong U.S. dollar. All of the news out of China has caused contagion to sweep across the globe. Global markets have become a lot more volatile as China is the world's second-largest economy. China is the demand side of the equation for most raw material markets, including crude oil. Therefore, Chinese weakness has caused lots of volatility and weakness in nations that provide the Asian nation with commodities. The Brazilian economy has gone into the tank because of a mixture of scandal and lower commodity prices. Last week, the Australian dollar fell below the 70-cent level against the U.S. dollar for the first time in years, as Australia suffers from lower commodity prices and decreasing demand from its largest trading partner, China. This all leads to lower demand for crude oil.
With big supplies these days and lower demand, the bear market in oil comes as no surprise to those who monitor the fundamentals. However, nothing is ever simple when it comes to crude oil and the fundamentals can sometimes be subjective.
The most bullish thing about crude oil, as I wrote in an article for Seeking Alpha, published on August 24, was that there was not a bull in sight. Meanwhile, there are issues in the world of oil that throw cold water on the bears as they found out so brutally in the sessions that followed the $37.75 lows. First, the Middle East is a very turbulent region and more than half the world's oil reserves are located there. The temperature has been rising in Yemen, where the Saudis and Iranians are involved in a proxy war. Yemen shares a long border with the Saudis, and there is lots of oil production on the Saudi side. Add to that logistical routes for the transport of crude could become hazardous given rising tensions in the region. The prospects for war and increasing violence in the Middle East are never bearish for the price of oil. OPEC has refused to cut production in the face of falling oil prices. While the low-cost, rich producers like the Saudis and Kuwaitis can tough out this period to build market share, other member nations cannot. Members like Nigeria, Angola, Ecuador, Algeria, Venezuela and others are pushing the cartel to change policy so that prices can rise.
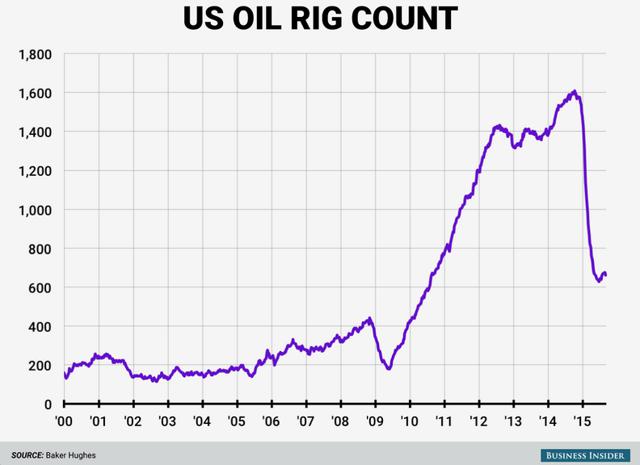
Another bullish factor for the price of oil is that rig counts in the U.S. dropped by 13 as of Friday, September 4, according to Baker Hughes.
(click to enlarge)
The number of rig counts has dropped from over 1,600 a year ago to the current level of 662. Falling rig counts will eventually translate into lower U.S. production, and daily output is likely to fall below 9 million barrels per day in the months ahead.
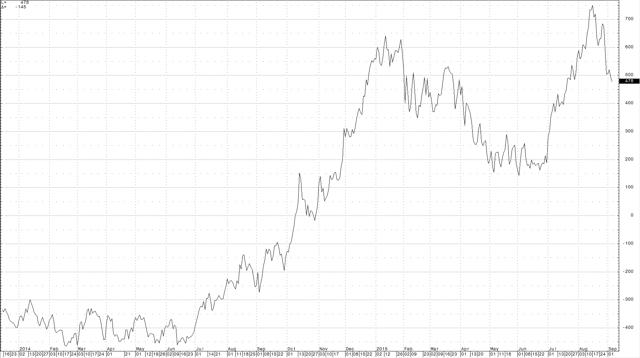
Trying to understand the fundamentals for crude oil market structure often provides a real-time view of supply and demand fundamentals. As the chart of NYMEX December 2015-December 2016 term structure for crude oil indicates, the contango has narrowed in crude oil, meaning the market has become tighter lately.
(click to enlarge)
This spread has dropped from $7.50 on August 17 to close last Friday at $4.78. Contango on this spread has moved from 17.7% to 10.4%. Brent crude spreads also narrowed over the period. It is natural for these spreads to move lower as prices appreciate. However, it is worth watching these spreads, as they will indicate if the world is truly awash in oil. One oil expert, who has an amazing record of accomplishment of the past three decades in calling the oil market, does not think so.
Andy Hall has had a rough time lately; his hedge fund Astenbeck Capital reported losses of 17% in July, the second-largest loss ever. Hall recently wrote to his investors, "The world, whilst moderately oversupplied, is not awash in oil." He added that there is still room to store 200 million barrels of oil and the current price of oil reflects a "worst case scenario." I know Andy Hall very well. For the greater part of the 1990s, I sat next to him every day at Phibro. Andy is a brilliant trader and he is an expert analyst when it comes to understanding the balance sheet for oil around the world. He also takes a great deal of risk. There are times when the market hands him enormous pain; however, he has patience and over time, he is right far more than he is wrong. Therefore, I do not discount anything he says; rather, I pay close attention, as should others in the market.
The situations in China, the Middle East, Europe and the upcoming Federal Reserve meeting in September, which will reveal if the central bank decides to raise interest rates for the first time in a decade, mean volatility is ahead for all markets. Stocks, bonds and currencies will see increasing trading ranges in the weeks ahead. Meanwhile, the most volatile asset class is commodities. These prices are likely to continue to wow us with crazy moves. Fundamentals and technicals aside, commodities are volatile and the slightest news will cause huge intraday moves in the weeks ahead. Crude oil now trades at over 90% daily volatility. This is a market for nimble traders, not for investors. Volatility is a seasoned trader's paradise but at the same time, it is a nightmare for investors.
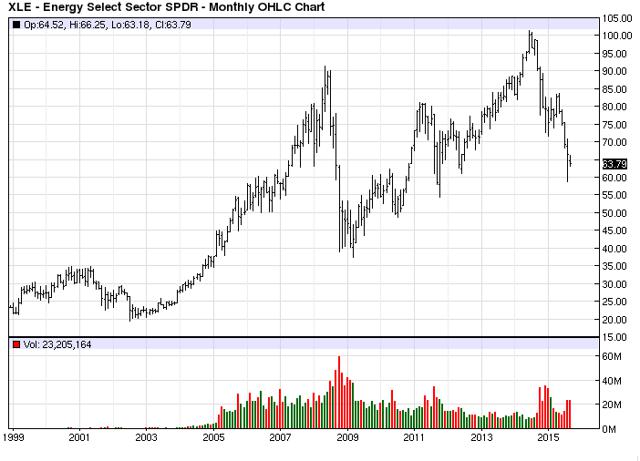
A huge percentage of equity indices in the United States contain companies that operate in the oil patch. On Friday, September 4, the Energy Select Sector SPDR ETF (NYSEARCA:XLE) closed at $63.59 per share. It traded to lows of $58.74 on Monday, August 24 when the you-know-what hit the fan. The index is approaching 2011 lows.
(click to enlarge)
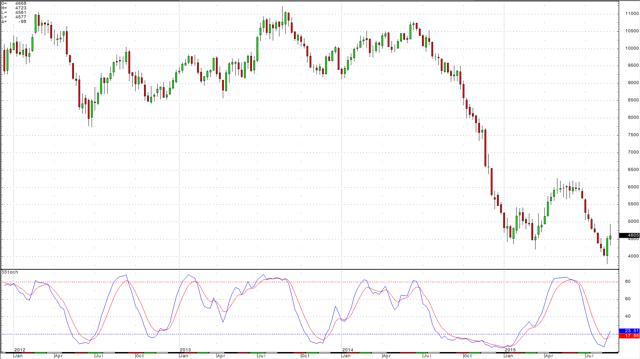
The trend is clearly lower. The weekly chart for crude oil looks slightly better as momentum has shifted to the upside given the vicious price recovery.
(click to enlarge)
The slow stochastic, a momentum indicator, has crossed to the upside on the weekly NYMEX crude oil chart.
These days there is so much action in crude oil that it is hard to keep track of everything. The same is true for all markets. Crude oil is a leader in the commodity space and it has a great deal of influence on other asset prices around the globe. With volatility raging and bullish and bearish factors at odds, it is hard to come up with a firm opinion these days. The Labor Day weekend came at a good time for the crude oil market; the traders need a rest. The coming weeks are likely to bring more excitement to all markets and crude oil is no exception. Crude oil is the psychotic horse and the world economic landscape is the burning barn these days. As a bonus, I have prepared a video on my website Commodix that provides a more in-depth and detailed analysis on oil right now to illustrate the real value implications and opportunities available in this market today.
Seeking Alpha


