
(click to enlarge)
OPEC crude only production was up 23,000 bpd in May, but that was after April had been revised upward by 110,000 bpd.
(click to enlarge)
Almost no change is Saudi production, down 5,000 bpd to 10,107,000 bpd.
(click to enlarge)
Iraq had the largest change of all, up 105,000 bpd to 3,800,000 bpd.
(click to enlarge)
Kuwait suffered the largest drop in May, down 77,000 bpd to 2,685,000 bpd.
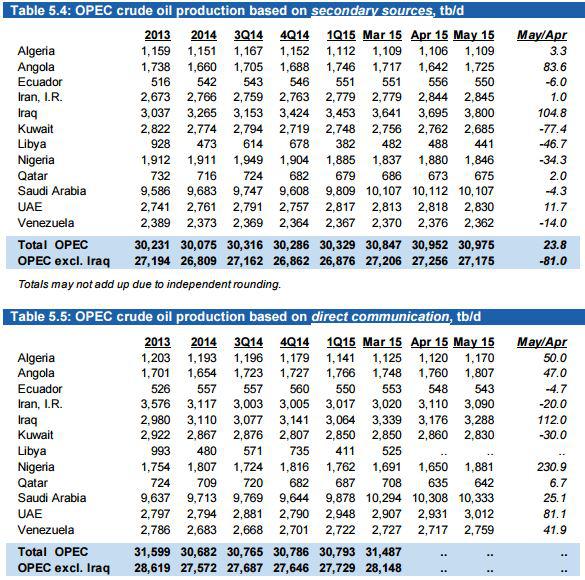
Above are the total changes for all OPEC countries. The top chart, "Secondary Sources" is the one I always use.
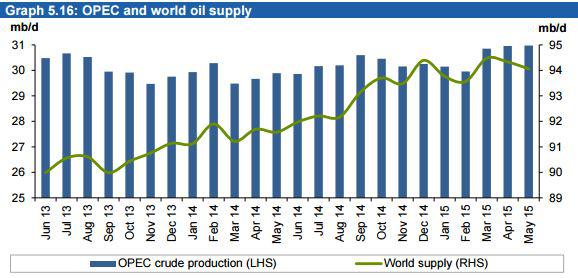
OPEC is expecting world oil supply to grow by 680,000 bpd in 2015.
Non-OPEC oil supply in 2015 is projected to grow by 0.68 mb/d, in line with the previous forecast and below last year's strong growth of 2.17 mb/d. OPEC NGLs are forecast to grow by 0.19 mb/d to average 6.02 mb/d in 2015, following growth of 0.18 mb/d in 2014. In May, OPEC production rose to 30.98 mb/d, up by 0.02 mb/d, according to secondary sources.
However, world oil supply fell in May. They are talking all liquids here.
World oil supply preliminary data indicates that global oil supply decreased by 0.27 mb/d to average 94.06 mb/d in May 2015 compared with the previous month. The decline of non-OPEC supply in May decreased global oil output, which was partially offset by an increase in OPEC production. The share of OPEC crude oil in total global production increased slightly to 32.9% in May compared with the previous month at 32.8%. Estimates are based on preliminary data for non-OPEC supply and OPEC NGLs, while estimates for OPEC crude production come from secondary sources.
Updated oil production charts of all twelve OPEC countries can be found at OPEC Charts.
Looking at the USA, we get a mixed picture from the EIA.
(click to enlarge)
The EIA's Weekly Group says US C+C production is soaring. They have US production, in early June, at 9,610,000 bpd and rising. Since the last week in April, they have total US production up by 227,000 barrels per day.
(click to enlarge)
However, over across the hall at the EIA, where the shale folks work, they say US Shale oil peaked in April and was down over 115,755 barrels per day in June. And since shale is where all the action is, then we could expect total US production to be down by at least that amount.
The weekly folks say total US C+C production was up 227,000 barrels per day since April, while the shale folks say production was down 115,755 bpd and then will be down by another 93,000 bpd by the time July rolls around. Anyway, the difference between what the weekly EIA folks say and what the shale EIA folks say is over 342,000 barrels per day. I think we can safely say that one of them is just flat out wrong.
(click to enlarge)
The above is from the EIA's Short-Term Energy Outlook which came out Tuesday. They have US Total Liquids up 80,000 bpd April to June. But they have all liquids peaking at that point and in a slight decline until October of 2016.
Of course, shale production is not total C+C production and total C+C production is not total liquids production, but they should all three go up or down together. Shale is where all the action is and total C+C and total liquids should follow shale, not in lock step of course but pretty close. But the idea of different groups at the EIA all coming up with different production numbers is getting a little absurd. It is, and should be, causing a lot of people to lose any confidence in anything the EIA does publish.
(click to enlarge)
The EIA's Short-Term Energy Outlook has Non-OPEC total liquids peaking in October at 58,600,000 bpd before dropping over a million barrels per day in January, February and March, then heading back to new highs reaching 59,080,000 bpd in October 2016.
Sustainability, transition, carrying capacity or whatever. There has been a lot of discussion on these subjects in the comments section lately. I plan on a post on these subjects in late June or early July. In the meantime, I am cramming in every article, YouTube video and article I can find on the subject. I watched two great ones last night, they are Nate Hagens' latest on the subject:
Energy, Credit and the End of Growth, Nathan Hagens and
Nate Hagens - Turning 21 in the Anthropocene
The first, 25 minutes long is basically a short version of the second, 56 minutes long. But both are very good, and have some very alarming stats in them. Anyway, as I said I am boning up on the subject. I will not be joining much of the ongoing discussion on these subjects but will save my opinions until the post in about a month or less. But in the meantime, I will be posting more links to other people's opinions on this subject.
By Ron Patterson /seekingalpha.com