
Summary
Oil demand in 2015 isn't weak, it is strong especially in the United States where consumption has surged.
Relative to 2013, oil demand in 2015 has increased by over 800,000 barrels per day which is nearly equal to a full year of global growth.
This demand surge has been greatly underestimated by the IEA and is a major reason for the "missing barrels" in the IEA monthly reporting.
Too much oil. Yes, we agree that is what the world has sitting in OECD storage at the current moment. However we think that the market and most investors have missed the turn in the daily oil supply and demand changes that have occurred over the course of the year.
The glut in oil happened at the end of 2014 and in the first four months of 2015 folks. As we recently noted global oil inventories have actually behaved quite normally since the start of May.
What we want to do in this article is as per usual focus on the data and not provide unsubstantiated opinion. In this instance we would like to bring readers up to speed on the surprising positive response that oil consumers around the world have had to low oil prices. Especially in the United States.
The United States - Who Said Demand Was In Decline?
The demand reaction to low oil prices has been the most surprising in the United States. We spent some time drilling into the EIA data and found some very interesting information. Because we wanted to compare demand in 2015 against a year where oil prices were high we focused on 2015 and 2013 rather than 2014. Oil (NYSEARCA:USO) prices fell significantly and demand responded quickly in the fall of 2014.
The graph below plots the EIA U.S. oil consumption data for 2015 and 2013 on the same chart:
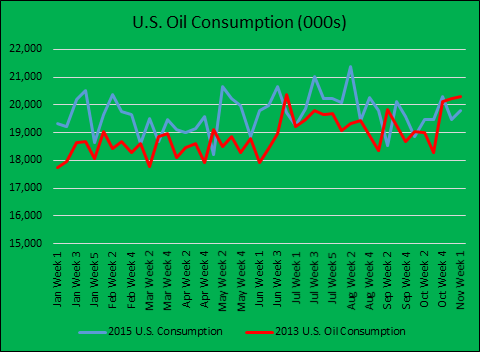
The graph pretty clearly shows that 2015 consumption was above 2013 for most of the year but the lumpiness doesn't do the size of the consumption increase justice. To better show the magnitude of the demand increase we prepared the following graph which tracks just the difference year on year between 2015 and 2013.
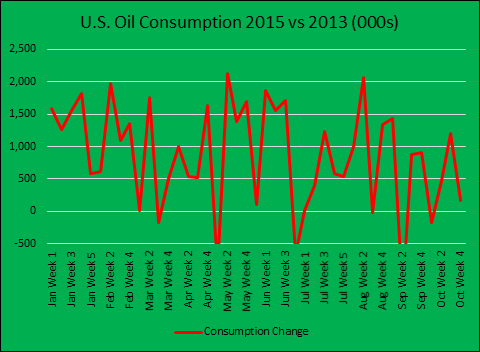
The size of the increase demand in some weeks is very surprising. The data points are above the one million barrel increase line almost as often as they are below it. A million barrel per day increase in consumption in the U.S. is close to 5%. On a monthly basis the year on year increases between 2015 and 2013 look like this:
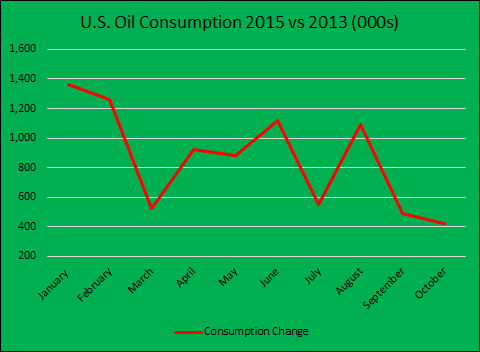
At no point has 2015 monthly demand not been at least 400,000 barrels higher in the United States for any of the months. The average increase for 2015 over 2013 has been almost 860,000 barrels per day.
That is a huge increase in demand from just one country. Yet the most common type of media reporting on the oil markets is like this article titled "An Oil-Soaked Globe as Production Keeps Climbing and Demand Falls".
| Month | Increase |
| January | 1,366 |
| February | 1,259 |
| March | 525 |
| April | 926 |
| May | 883 |
| June | 1,116 |
| July | 551 |
| August | 1,095 |
| September | 487 |
| October | 422 |
| Average | 863 |
Yes, inventory levels are very high and yes the price of oil is low. But supply and demand are not materially out of whack and the trend is for daily supply to fall below demand as production outside of OPEC is throttled by a lack of investment. Investors need to ignore the dark clouds surrounding the oil market today and look six to twelve months forward when the media will be singing a very different tune.
Seeking Alpha